Translation under review. The illustrations are still in Portuguese.
You stopped in the middle of this chapter.
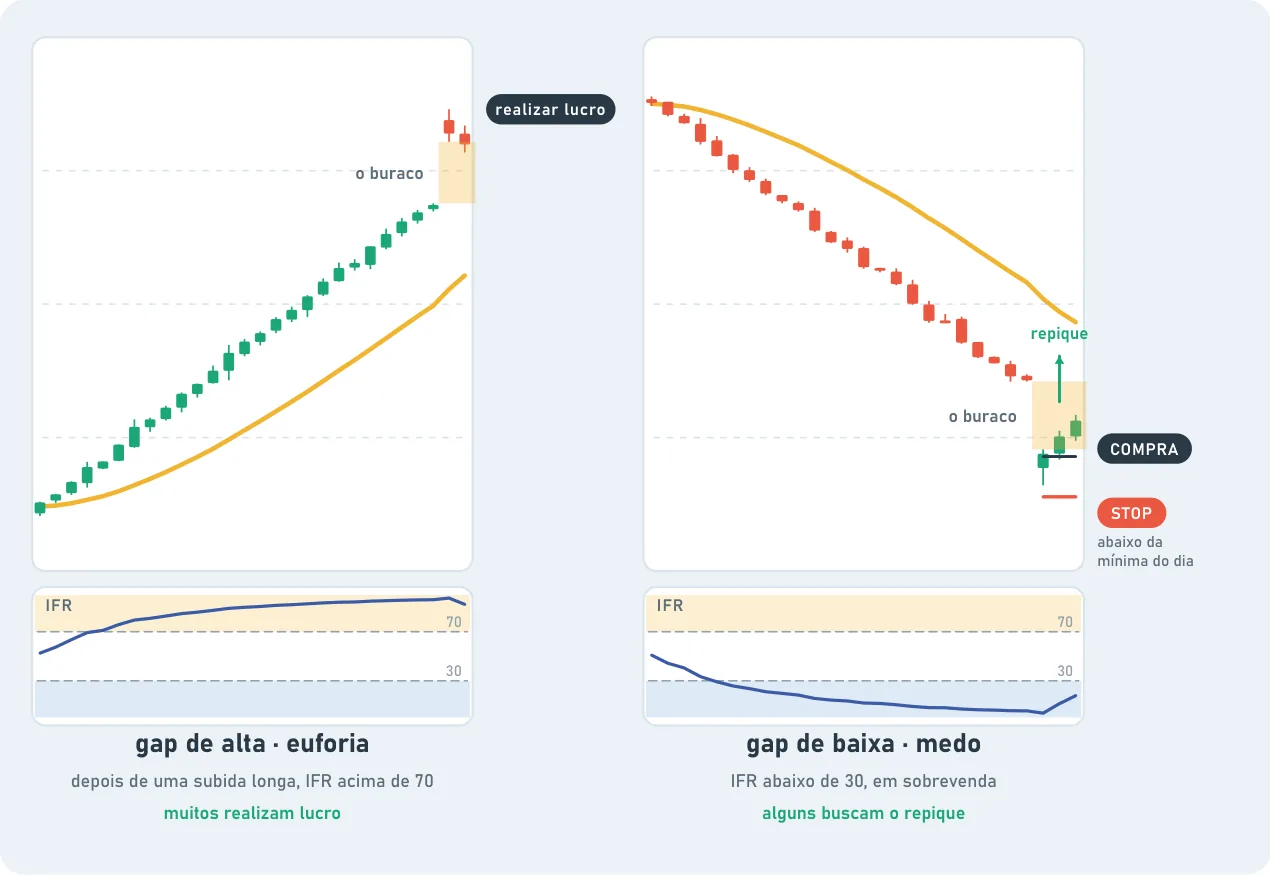
The hole in the chart. A gap happens when the price opens far away from where it closed the day before. Between the close and the open there were no trades, so a hole is left. Often it's emotion that built up overnight.
Gap up: it opened far above. Euphoria.
Gap down: it opened far below. Fear, sometimes panic.
Against the emotion. Trading a gap often means doing the opposite of what the emotion tells you. The euphoria at the open may be the place to take profit. The panic at the open, together with a strong oversold reading, may be the place to look for a bounce.
The climax gap. In an asset that was already going up nonstop, a very aggressive gap up can mark a short-term top. It's the last person who still hadn't bought, buying. The opposite also holds: a strong gap down with an oversold reading can mark a bottom.
Two scenarios a lot of people watch.
Scenario
When
What some traders do
Euphoria gap
Strong gap up after a long rise
They take profit, or trade against it looking to buy back lower
Fear gap
Gap down with the RSI oversold
They look for the bounce, with a stop below the day's low
The gap that doesn't fill. Watch whether the price can get back inside the previous day's range. If it can't, the strength in the direction of the gap is real, and standing against it is dangerous.
Context first. A gap after a quarterly earnings report has different dynamics: the news changed the company's story. A gap from the market's mood is one thing. A gap from a new fact is another.
Small gaps. On very short timeframes, small gaps are just momentary holes in . What matters here are the gaps on the daily chart.
Words in this chapter
Liquidity
How easy it is to buy or sell without moving the price much.