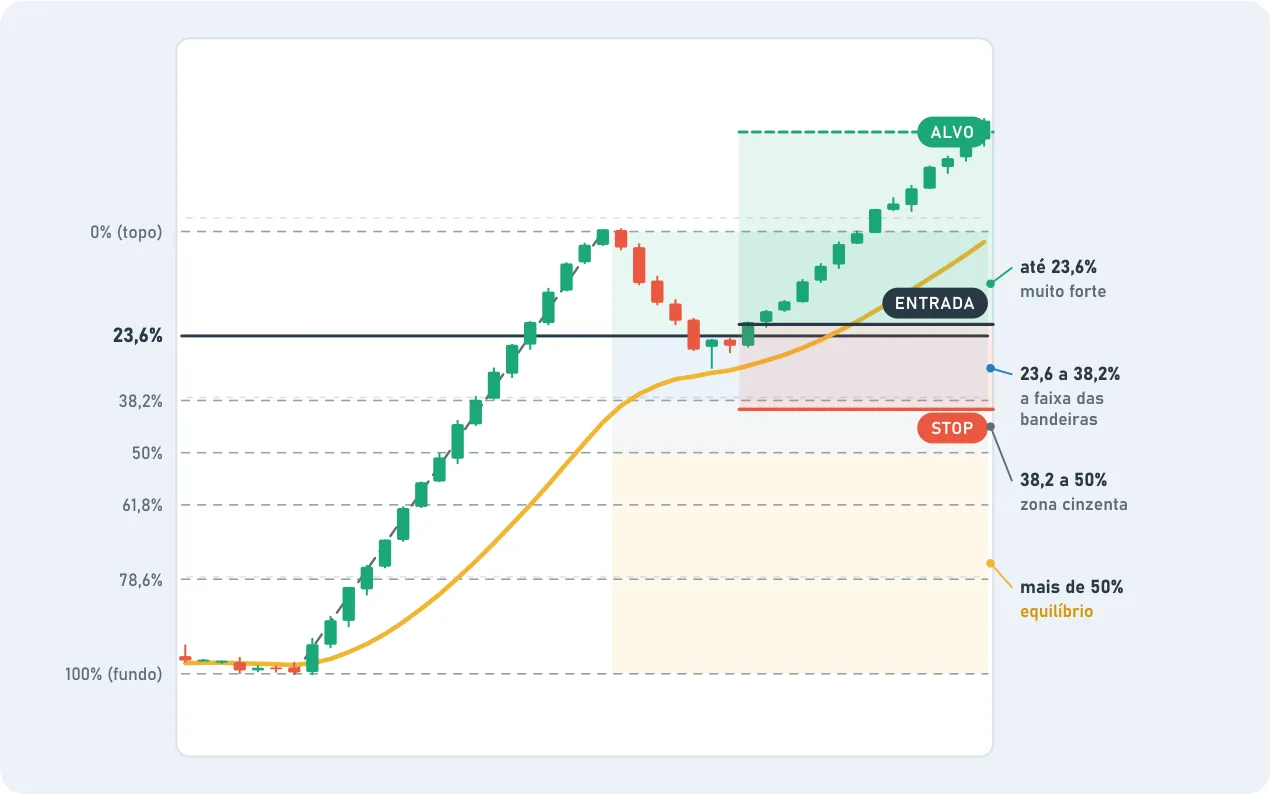
How much did the price give back? After a strong move, the price stops and gives back a piece of it. Fibonacci measures how much. The depth of that pullback shows the strength of the move: the less the price gives back, the stronger the side that was pushing.
How to draw it. Use the Fibonacci tool on your platform. In a move up, drag from the bottom where the move started to the top. The tool draws the lines for you: 23.6%, 38.2%, 50%, 61.8% and 78.6%.
23.6%: the most important line. It's the first line, the shortest pullback. A price that stops near 23.6% barely took a breath: the side pushing didn't even let the other side get started. The zone between 23.6% and 38.2% is where the strongest flags are born (chapter 2). That's why, before any other line, 23.6% is the one worth looking at.
Four zones.
| The price gave back | What it suggests | What a lot of people watch |
|---|---|---|
| Up to 23.6% | Almost no pressure against it. The is very strong | If the price holds here, the continuation gets stronger |
| Between 23.6% and 38.2% | A short breather. The zone of strong flags | How the price reacts inside the zone, even better if it lines up with an earlier or with the moving average |
| Between 38.2% and 50% | Gray zone. It may continue, it may turn into a long pause | More information before deciding |
| More than 50% | The flag became unlikely. The price may keep swinging between the extremes: a balance | The extremes of the balance, and which one breaks first |
Where the idea dies.
In the flag: below 38.2%, or past the support that is holding the price. If it breaks, the flag is dead.
In the balance: past the extreme that invalidates the structure. If that level falls, a new trend may be starting.
Check a bigger timeframe. A breakout on its own says little. If the balance broke on the 5-minute chart, the 1-hour chart shows the context. Sometimes what looks like a reversal on the small one is just a 23.6% or 38.2% pullback on the big one. Fractals again.